Website Performance Indicators (WPIs) are your website's vital signs. They're the concrete numbers that tell you exactly what’s working, what’s broken, and where you can improve. Think of them less as abstract data points and more as a clear roadmap showing you how to grow.
What Are Website Performance Indicators?
Imagine your website is a high-performance car. Your WPIs are the gauges on the dashboard. They tell you about engine health (server uptime), speed (page load times), fuel efficiency (conversion rates), and even how much your passengers are enjoying the ride (user engagement). These aren't just technical stats for your IT team; they connect your site’s real-world performance directly to your business goals.
To get the full picture, you can't just look at one gauge. You need to see how they all work together. This infographic gives a great overview of some of the most critical indicators you should be watching.
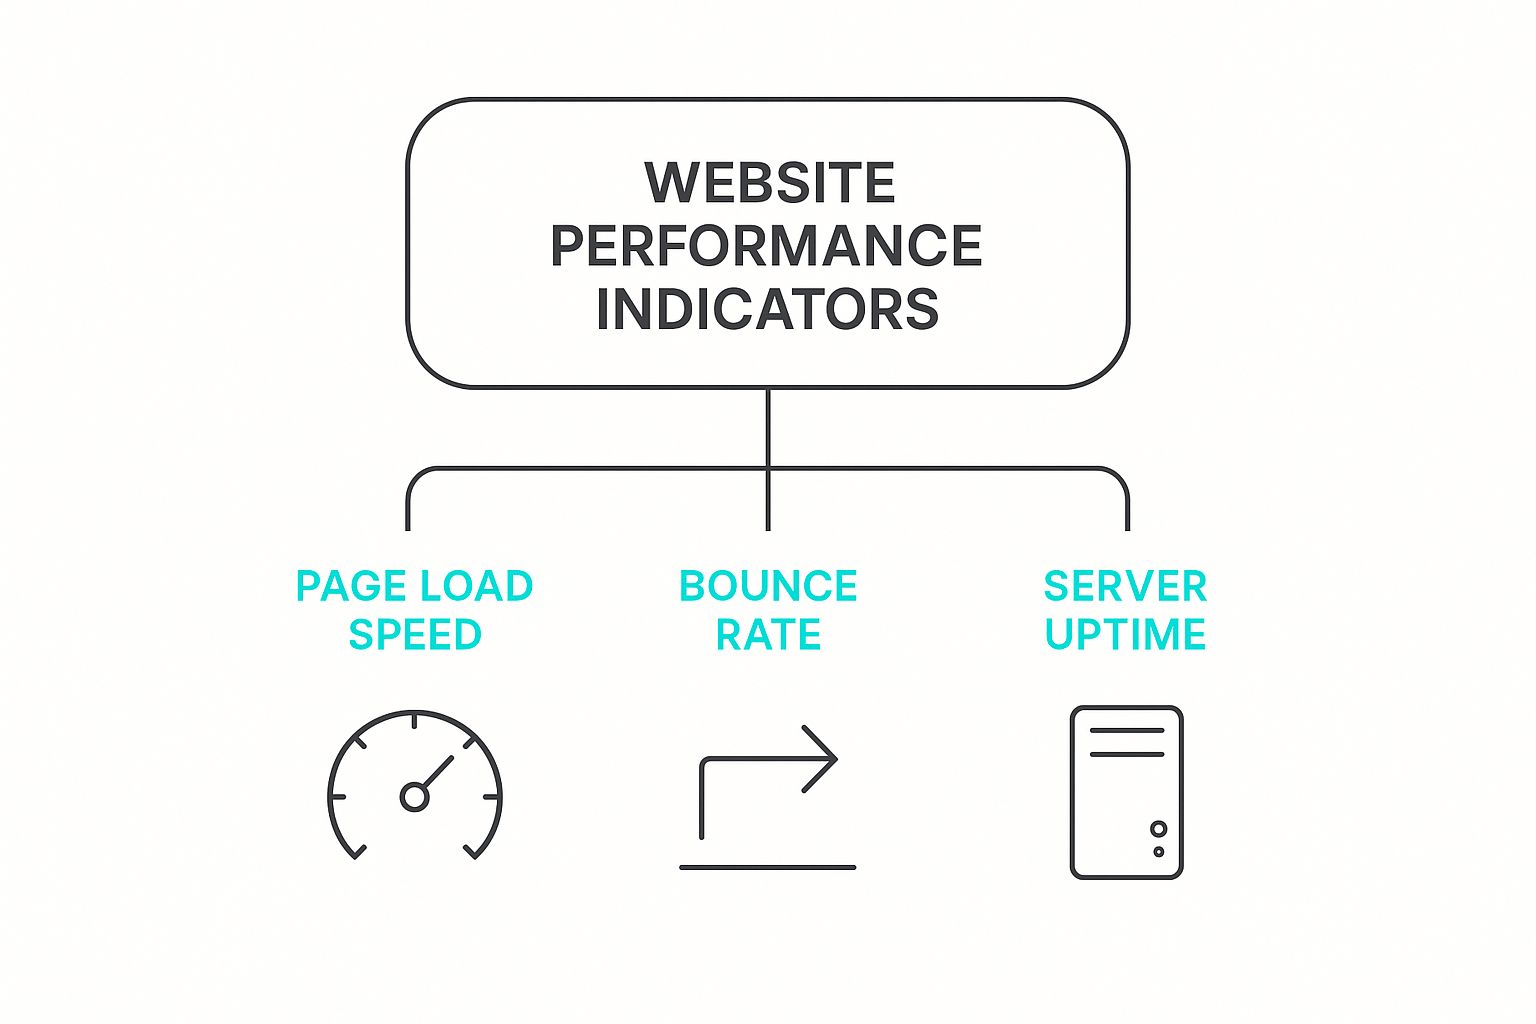
As you can see, technical elements like speed and uptime are the foundation. They directly impact user-focused metrics like bounce rate, showing just how interconnected everything is.
The Three Pillars of Website Performance
Looking at these metrics one by one can give you a skewed perspective. A truly effective approach is to group them into three core pillars. Each pillar tells a different part of your website's story, and together, they paint a complete picture.
To make this clearer, let's categorize these indicators into what I call the "Three Pillars of Website Performance."
| Pillar | What It Measures | Example Indicators |
|---|---|---|
| Technical Health | The "under-the-hood" reliability and stability of your site. | Uptime, Page Load Speed, Error Rate |
| User Engagement | How visitors interact with your site once they arrive. | Bounce Rate, Session Duration, Pages per Visit |
| Business Outcomes | The connection between site performance and tangible business results. | Conversion Rate, Leads Generated, Revenue |
This framework helps you see that a fast site isn't enough if users are confused, and engaged users don't help if they never convert. A healthy website performs well across all three pillars.
It’s easy to get tunnel vision and obsess over one area, like shaving milliseconds off your load time while completely ignoring why people are leaving your site in the first place. The goal is to create a seamless experience from the moment a user lands on your site to the moment they convert.
Beyond just speed, a truly high-performing website is measured by a whole suite of metrics. Google's Core Web Vitals—which track loading (LCP), interactivity (INP), and visual stability (CLS)—have become the gold standard for a reason. They provide a clear benchmark for user experience. To learn more, you can explore these essential website performance indicators and see how they contribute to success.
Ultimately, tracking these WPIs allows you to find performance bottlenecks and draw a straight line from your site’s technical health to your business's bottom line.
Gauging Your Site's Technical Health

Before anyone even sees your brilliant content or clicks a single button, a critical first impression has already been made. It’s a silent, technical handshake between your visitor’s browser and your website's server. Get this right, and you’ve set the stage for a great experience. Get it wrong, and you risk losing them before you even had a chance.
Think of these technical metrics as the foundation of your house. If the foundation is shaky, it doesn't matter how beautiful the interior design is. The primary signals to watch are Google’s Core Web Vitals, which aren't just technical jargon—they're a direct measure of how a real person experiences your site's speed and stability.
Demystifying Core Web Vitals
These three metrics might sound a bit intimidating, but they’re actually quite intuitive when you think about them from a user's perspective. Each one tells a story about a different part of that initial interaction.
- Largest Contentful Paint (LCP): This is all about perceived loading speed. Imagine walking into a store. LCP is how fast the main, most prominent product display comes into view. A good LCP is under 2.5 seconds—anything longer feels sluggish.
- Interaction to Next Paint (INP): This one measures responsiveness. It’s the digital equivalent of asking a store employee a question and getting an immediate answer. INP measures the time between a user’s action (like a click) and the moment the page visually responds. You want this to be under 200 milliseconds to feel instantaneous.
- Cumulative Layout Shift (CLS): This is all about visual stability. Have you ever tried to click a button on a page, only to have an ad load in and push it down, causing you to click the wrong thing? That's layout shift, and it's incredibly frustrating. A low CLS score means your page is stable and predictable.
Key Takeaway: A site that loads its main content quickly (LCP), reacts instantly to user input (INP), and doesn’t jump around unexpectedly (CLS) delivers a far better user experience. It builds trust from the very first second.
Beyond the Core Vitals
Another foundational metric you should know is Time to First Byte (TTFB). This is the very first signal that your website is alive and listening. Think of it as how long it takes for a restaurant host to greet you after you walk in the door. It's the time between the browser asking for your site and the server sending back the very first piece of data. A snappy TTFB (under 0.8 seconds) shows your server is awake and ready for action.
Website load time is a massive factor in user satisfaction. Data from Google's Chrome User Experience Report shows that the average LCP on mobile in the US is about 1.9 seconds. To stay competitive, you need to be in that ballpark or better, which means focusing on effective website speed optimization tips.
Tools like Google PageSpeed Insights are your best friend here. They'll analyze all these technical health metrics and give you a straightforward report with concrete suggestions for improvement. While you're under the hood improving your site's performance, it’s also the perfect opportunity to double-check your security. Our website security checklist is a great resource to help you cover all your bases.
Of course. Here is the rewritten section with a more human, expert-written feel.
Are Your Visitors Actually Engaging with Your Site?
So, you've built a technically sound website. The pages load in a blink. That's a huge win, but it’s really just the first step. What happens after the page loads? Do people stick around? Do they click on anything? This is where we start looking at engagement metrics, which tell the human side of the story.
Think of it this way: your technical metrics are about getting people in the door of your party quickly and easily. Your engagement metrics tell you if they're actually having a good time, mingling, and exploring, or if they're just grabbing a drink and leaving out the back door.
The Truth About Bounce Rate
One of the most talked-about—and most misunderstood—metrics is Bounce Rate. At its core, it's the percentage of visitors who land on one of your pages and then leave without doing anything else. No clicks, no form submissions, nothing. Just a single-page visit.
A high bounce rate can make you sweat, but it’s not automatically a red flag. The context is what truly matters.
- A "Bad" Bounce: Someone hits your slick new product page, gets confused by the layout, and immediately clicks the back button. That’s a bounce you want to fix—it points to a clear issue with user experience.
- A "Good" Bounce: A user Googles "what is the capital of nebraska," finds your blog post that gives the answer ("Lincoln"), and leaves happy. They got exactly what they needed. The bounce rate is high, but the visit was a success.
A high bounce rate isn't an instant sign of trouble. You have to dig deeper and look at the why. Is the user leaving feeling frustrated, or did they leave feeling satisfied?
Beyond the Bounce: Session Duration and Page Views
To get the full story, you need to look at bounce rate alongside other key indicators that show how invested people are in your site. Two of the most important are Average Session Duration and Pages per Session.
Average Session Duration is pretty straightforward: it's the average amount of time people spend on your site in a single visit. Longer sessions usually mean your content is grabbing their attention and keeping them hooked. If you run a blog, a long session is a gold star. If it's a simple "Contact Us" page, a short visit is perfectly normal.
Pages per Session tells you, on average, how many different pages a person looks at before they leave. This metric is a great indicator of how well your site encourages discovery. Things like smart internal linking and a clear navigation menu can really drive this number up, leading visitors deeper into your world.
Just like with bounce rate, what's "good" here depends entirely on your goals. For an online store, a high number of pages per session is fantastic—it means shoppers are browsing. For a landing page built for a single download, a low number might be exactly what you expect. When you start looking at these website performance indicators together, you stop seeing abstract numbers and start understanding the real journey your visitors are taking.
Connecting Website Performance to Business Growth

So far, we've talked about the technical side of things—site health, speed, and keeping visitors engaged. While those are incredibly important, they're really just the foundation. Now, let's connect the dots and show how a well-performing website directly fuels your bottom line.
The star of this show is your Conversion Rate.
At its core, a conversion is just a visitor taking a specific, valuable action you want them to. This is the whole point of conversion rate optimization (CRO), a field dedicated to making it easier and more compelling for users to take that step. But it's not a one-size-fits-all metric.
Macro vs Micro Conversions
To really understand what's happening on your site, you need to look at conversions in two different ways.
-
Macro-Conversions: These are the big wins. They're the primary goals that directly impact your revenue or lead generation, like a completed purchase, a submitted contact form, or a new trial signup.
-
Micro-Conversions: These are the smaller, supporting actions. Think of them as breadcrumbs a user leaves on their path toward a bigger goal. Examples include signing up for your newsletter, downloading a whitepaper, or watching a demo video.
Why track both? Because micro-conversions tell a story. While a macro-conversion is what you ultimately want, a cluster of micro-conversions shows you have an engaged user who is on the right track.
Key Insight: A visitor who completes multiple micro-conversions is a warm lead. Even if they don't buy today, their actions signal a strong interest and a high likelihood of becoming a customer down the road.
Performance That Builds Long-Term Value
A great website experience isn't about getting a single sale; it's about building a relationship that grows over time. How well your site performs has a direct impact on two critical business metrics that define long-term success.
First up is Average Order Value (AOV), which is simply the average amount a customer spends in a single transaction. When a site is fast, easy to navigate, and feels trustworthy, customers are more comfortable exploring and adding more to their cart. Following solid web design best practices makes this feel natural and effortless for them.
Then there's Customer Lifetime Value (CLV). This metric forecasts the total revenue you can expect from a single customer over their entire relationship with your business. A fantastic first impression—no lag, no broken links, no frustrating glitches—builds the trust that brings people back again and again.
This proves that optimizing your website isn't just a technical checklist item. It's a fundamental strategy for creating sustainable, long-term growth.
Choosing the Right Tools to Track Performance
So, you know what you need to track. But how do you actually get the numbers? You need the right set of tools. Think of it like a mechanic's workshop—you can't diagnose an engine problem with a stethoscope. The same principle applies here; different tools are built for different jobs.
Picking your toolkit can feel like a huge task, but most website performance tools fall into one of three main buckets. Once you understand what each type does best, you can build a complete monitoring setup without getting bogged down by endless options. The real goal here isn't just to collect data, but to gather insights you can actually act on.
Web Analytics Platforms
This is mission control for understanding your audience and how your site contributes to your business goals. These platforms answer the big "what happened?" and "how many?" questions about your visitors.
The undisputed heavyweight here is Google Analytics 4 (GA4), and it's free. GA4 is built around understanding user journeys, making it perfect for tracking crucial engagement and business metrics like:
- Average Session Duration: How long are people actually sticking around?
- Conversion Rates: Are visitors doing what you want them to, like signing up for a newsletter or making a purchase?
- User Demographics: Who is your audience, really? Where are they coming from?
Getting GA4 set up is your first step to getting that high-level view of whether your website is actually doing its job.
Key Insight: Web analytics platforms are what connect the dots between clicks and revenue. They show you the tangible impact of user engagement on your most important business goals.
Technical Performance Tools
If analytics platforms are your business strategists, these tools are your pit crew. They specialize in diagnosing your site's speed and overall technical health, sniffing out the "under-the-hood" issues that make people leave before they even see your amazing content.
Two fantastic and free options are Google PageSpeed Insights and GTmetrix. You just pop in a URL, and they run a battery of tests, spitting out a detailed report on things like Core Web Vitals (LCP, INP, CLS) and Time to First Byte (TTFB). Even better, they don't just give you a grade; they give you a prioritized to-do list for fixing what’s broken, from compressing images to improving server response times.
User Behavior Tools
Analytics data tells you what users did, but user behavior tools show you why they did it. These tools are like a one-way mirror, giving you a visual record of how real people experience and interact with your site.
A leader in this space is Hotjar. It gives you powerful tools like heatmaps, which create a visual map of where people click, move their cursors, and how far they scroll down a page. You also get session recordings—anonymized videos of actual user visits. This kind of insight is pure gold for finding confusing navigation, spotting broken buttons, or identifying other user experience frustrations that raw numbers could never show you.
Essential Tools for Website Performance Monitoring
Choosing the right tool depends entirely on what you're trying to measure. This table breaks down the main categories to help you decide where to start.
| Tool Category | Example Tools | Primary Use Case |
|---|---|---|
| Web Analytics | Google Analytics 4, Matomo | Tracking user engagement, conversions, and business-focused metrics. Answers "what" users are doing. |
| Technical Performance | Google PageSpeed Insights, GTmetrix, WebPageTest | Diagnosing site speed, Core Web Vitals, and technical infrastructure issues. Finds "why" the site is slow. |
| User Behavior | Hotjar, Microsoft Clarity | Visually understanding user interactions through heatmaps and session recordings. Explains "why" users behave a certain way. |
Ultimately, a combination of tools from each category will give you the most complete picture of your website's health, connecting technical performance directly to user satisfaction and business outcomes.
A Practical Guide to Improving Your Website Metrics

Knowing your website performance metrics is one thing, but that data is useless until you do something with it. This is the fun part—where you turn those numbers and charts into real-world improvements. Making just a few smart tweaks to your site's technical health, content, and user experience can add up to make a huge difference.
The trick is to draw a straight line from a poor metric to a specific fix. Don't get overwhelmed by the data. Just think of it like a car's dashboard: when a warning light comes on, you know exactly which part of the engine needs a tune-up.
What to Do If Your Technical Metrics Are Slow
Slow technical stats, especially anything related to page speed, should be your first priority. Let’s face it, people have zero patience online. Research shows that 47% of visitors will bounce if a site takes more than two seconds to load. And even a one-second delay can drop your page views by 11%. Speed isn't a "nice-to-have"; it's essential.
Here’s how to tackle a couple of common speed culprits:
- Slow Largest Contentful Paint (LCP): This just means the most important part of your page is taking too long to show up. The usual suspects are massive image files. You can fix this by optimizing and compressing your images, using a Content Delivery Network (CDN) to serve them from a closer location, and telling browsers to cache your assets.
- High Time to First Byte (TTFB): If this number is high, your server is slow to respond to the initial request. This is often a hosting issue. You might need to upgrade your hosting plan or get a developer to optimize the code and database queries running in the background.
What to Do If Your Business Metrics Are Lagging
What if your site is technically sound, but you're still not hitting your business goals? Now it’s time to shift your focus from the "engine" to the "in-car experience." Your goal is to make it as easy and intuitive as possible for visitors to do what you want them to do.
Small points of friction in a user's journey can cause massive drops in conversions. Simply removing one unnecessary form field or making a button's text clearer can have an immediate and positive impact on your bottom line.
If your conversion rate is low, put on your detective hat and walk through the user’s path. Is your main call-to-action (CTA) obvious, convincing, and easy to spot? Try A/B testing different button colors, wording, or placements to see what works best. You can also streamline your checkout or contact forms by ditching any fields that aren't absolutely necessary.
Lasting success comes from constantly monitoring these metrics and making steady improvements. If you're a business owner who'd rather focus on running your business, looking into professional website maintenance packages can be a great way to ensure an expert is always keeping an eye on these vital signs for you.
Answering Your Top Website Performance Questions
As you start paying closer attention to your website's performance, you'll naturally run into some practical questions. It's one thing to understand the definitions, but it’s another thing entirely to know how these metrics play out in the real world. Let's tackle some of the most common questions that pop up.
How Often Should I Actually Check My Performance Metrics?
You don't need to be glued to your performance dashboards every day. For most businesses, a thorough check-in once a month is the perfect cadence. This schedule is frequent enough to catch important trends but spaced out enough that you won't get bogged down by normal, insignificant daily blips.
Of course, there are a couple of key exceptions to this rule:
- After a Major Change: Always run a performance check right after you've pushed a big update live. This includes things like a site redesign, a new feature launch, or a switch to a new hosting provider.
- During a Big Campaign: If you're running a marketing campaign that's sending a flood of new visitors your way, you'll want to monitor your metrics more closely—maybe weekly or even daily—to make sure your site is holding up under the pressure.
Why Do I Get Different Scores from Different Tools?
You've probably noticed it already: Google PageSpeed Insights gives you one score, while a tool like GTmetrix shows you something completely different. This is perfectly normal.
Think of it like getting a car's 0-60 time tested on two different racetracks. The weather, the track surface, and even the driver will all influence the final number. Performance tools work the same way; they use different servers, network conditions, and devices for their tests, leading to different results.
The key is to stop chasing a perfect 100 on a single tool. Instead, focus on the upward trend of your scores over time and pay close attention to the actionable advice each tool gives you. The real goal is consistent, measurable improvement, not a single static grade.
What Is a "Good" Performance Score, Anyway?
While every site is different, a fantastic place to start is aiming for a "Good" score across all of Google's Core Web Vitals. For instance, getting your Largest Contentful Paint (LCP) under 2.5 seconds is a concrete and achievable target for most sites.
Ultimately, the best benchmark isn't a universal number—it's your direct competition. Use performance tools to see how your competitors' sites measure up. Your goal should be simple: be noticeably faster and more reliable than they are.
At Swish Web Designs, we take all the guesswork out of website performance. We don't just build beautiful sites; we handle the ongoing development and maintenance to ensure your online presence is always fast, secure, and delivering real results. Let us manage the technical side of things so you can get back to running your business. Visit swishwebdesigns.com to see how we help businesses in the Tri-Cities thrive online.


